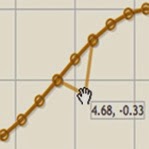
(javascript query plotting) jqPlot is a plotting and charting plugin for the jQuery Javascript framework. jqPlot produces beautiful line, bar and pie charts with many features:

- Numerous chart style options.
- Date axes with customizable formatting.
- Up to 9 Y axes.
- Rotated axis text.
- Automatic trend line computation.
- Tooltips and data point highlighting.
- Sensible defaults for ease of use.
jqPlot has been tested on IE 7, IE 8, Firefox, Safari, and Opera. You can see jqPlot in action on the
Numerous line style options
with 6 built in marker styles!

Drag and drop points with auto updating of data!
Trend lines computed automatically!
Log Axes with flexible tick marks!


